How to use Query Monitor to optimize performance
What is Query Monitor?
If you are developing in WordPress, the free Query Monitor plugin is an indispensable tool for debugging your site’s code and performance. On its website, it describes itself as “The Developer Tools panel for WordPress”.
Despite its name, Query Monitor enables you to inspect many aspect of your site. Below we will go into the following features that can help to analyze and improve performance:
- Database queries and errors
- PHP errors, warnings and notices
- HTTP API calls
- Memory usage
- Server environment information
Other useful developer information that Query Monitor shows in its panels:
- Hooks and actions
- Enqueued scripts and styles, including dependencies
- Theme template files
- Languages, translations and hooks
- Request and response headers and rewrite rules
- Block editor blocks
- Admin current screen information and hooks
- Transient updates
- User capabilities
- Conditionals
With Query Monitor active it will visually warn you about PHP errors, warnings and notices, blocking HTTP API requests, and possibly problematic (slow, duplicate) queries on the page you have loaded. If you are debugging an issue and are trying to find the deeper lying causes it offers all the clues you need to find the exact offending lines in the theme or plugin functions themselves.
Debugging database queries is something that Query Monitor does very well. Below, we’ll go into how to use Query Monitor to optimize database queries for performance.
Limitations
An important limitation of Query Monitor is that it shows information for debugging your current page load, as it is happening. It’s just a snapshot, meaning it does not log or display information about previous page loads or historical trends (although Query Monitor does offer some logging features for server messages and variables).
This limitation makes it hard to spot performance issues that happen infrequently, randomly, or only on specific times or in specific situations, like blocking HTTP API calls by plugins that are triggered by WP-Cron schedules.
To track these kinds of issues we recommend to additionally install the Log HTTP Requests plugin. This plugin (by FacetWP) logs all WP Core, plugin, theme and AJAX based WP_HTTP requests and stores their run time, so you can later diagnose potentially blocking requests.
Installation and activation
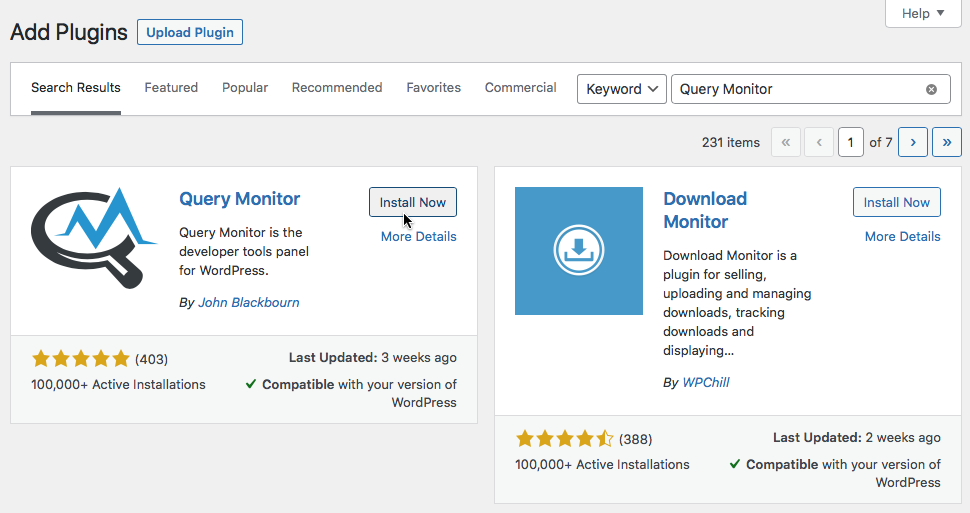
To install the plugin, go to the Plugins page in your site’s Admin and click the “Add New” button at the top. In the search field, enter “Query Monitor” and click the “Install Now button”. Finally, click the “Activate button” when it appears.
Turn off all caching
To determine the causes of possible page loading issues, first temporarily turn off any caching solution you have implemented: caching plugins (like WP Rocket, WP Redis, etc.), any caching done by your host (like WP Engine or Kinsta), and FacetWP’s Caching add-on. Otherwise, you may be measuring the speed of cached pages and the results will be skewed.
Testing pages without caching will show you the true speed of the page and will give more insight into any page loading issues: whether they are query/database related, plugin related, or something else. This is even more important for pages with facets because FacetWP uses AJAX requests, which are uncached by default.
Admin bar and navigation
After installing and activating Query Monitor, it shows up in your admin bar in the front-end as wel as the back-end:

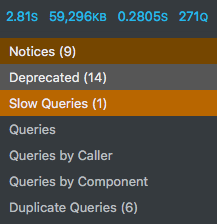
The output includes four metrics for the current page:
- Page generation time – 4.08 seconds in above screenshot
- Peak memory usage – 6.4 MB in above screenshot
- Database query time – 0.04 seconds in above screenshot
- Number of database queries – 87 in above screenshot
When you click on the metrics in the admin bar you’ll see a navigation dropdown with problematic sections marked in red brown or orange. The navigation items each open up in the Query Monitor panel at the bottom of the page, where you can find a wealth of information separated into useful sections:
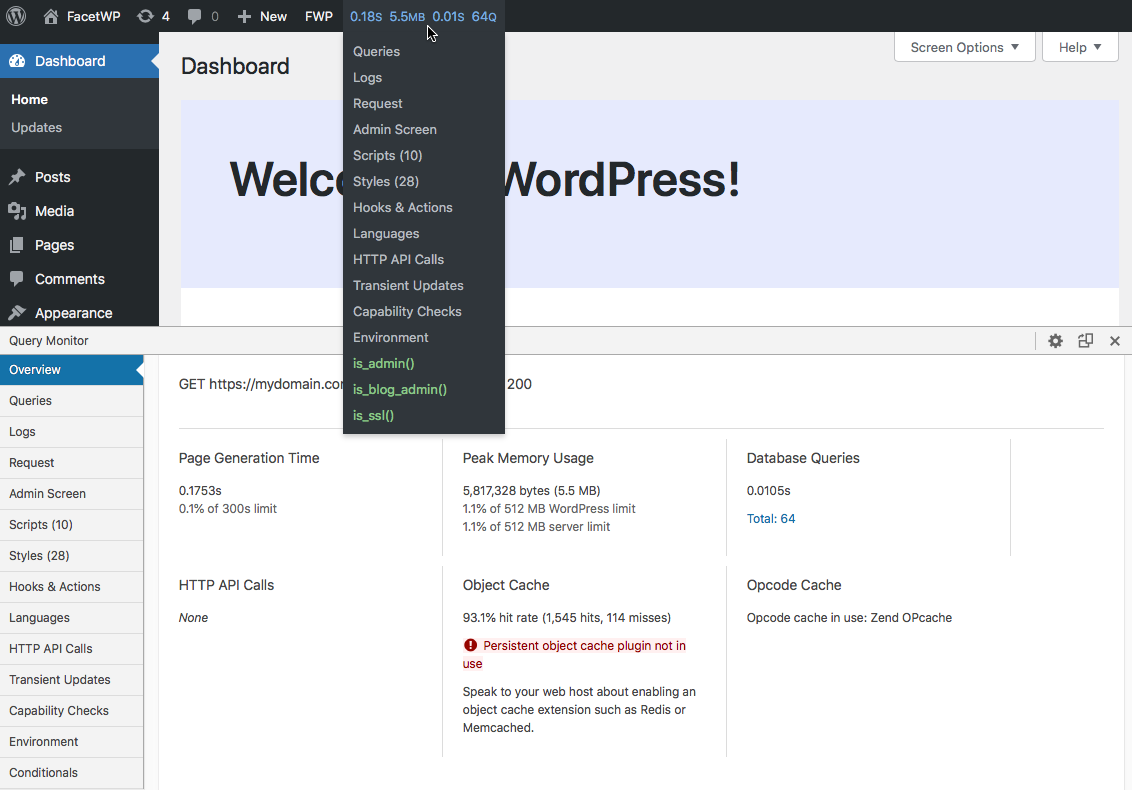
In the top right of the Query Monitor panel is a button to change show the panel on the right-hand side instead of at the bottom of the page.
Settings panel
The settings panel opens at the bottom of the page. You can access it in 2 ways:
- Go to the Plugins page, find Query Monitor and click its “Settings” link.
- Click on the Query Monitor metrics bar in the Admin bar. In the Query Monitor panel that opens at the bottom of the page, click on the cog/gear icon on the right top of the panel.
Set an autentication cookie
The Query Monitor interface and its information panels are only visible to Administrators (or Super Administrators on WordPress multisite).
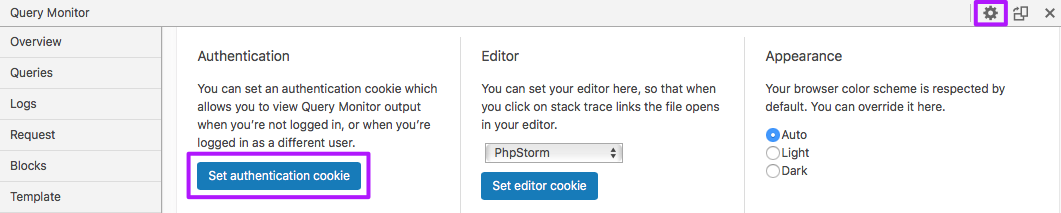
If you want to see how your website performs for visitors (logged out or logged in with a lower user role), Query Monitor lets you set an “authentication cookie”. You can do this by going to the settings panel, and clicking the “Set authentication cookie” button.
Other settings and constants
In the settings panel, you can also set your favorite code editor, so clicking on stack trace links the file opens directly in your editor. You can also select a color scheme.
The settings panel also list useful configuration constants that control the behavior of Query Monitor. You can add these to wp-config.php. Three useful examples:
How to use custom PHP code?
PHP code can be added to your (child) theme's functions.php file. Alternatively, you can use the Custom Hooks add-on, or a code snippets plugin. More info
// Hide WordPress core on the Hooks & Actions panel. Default: false define('QM_HIDE_CORE_ACTIONS',true); // Enable the Capability Checks panel (shows user capabilities). Default: true define('QM_ENABLE_CAPS_PANEL',true); // Disable Query Monitor entirely without de-activating the plugin. Default: false define('QM_DISABLED',true);
Optimizing your metrics
In the Overview panel, which is opened by clicking on the four metrics in the admin bar, each of the above-mentioned four main metrics is displayed with some contextual information:
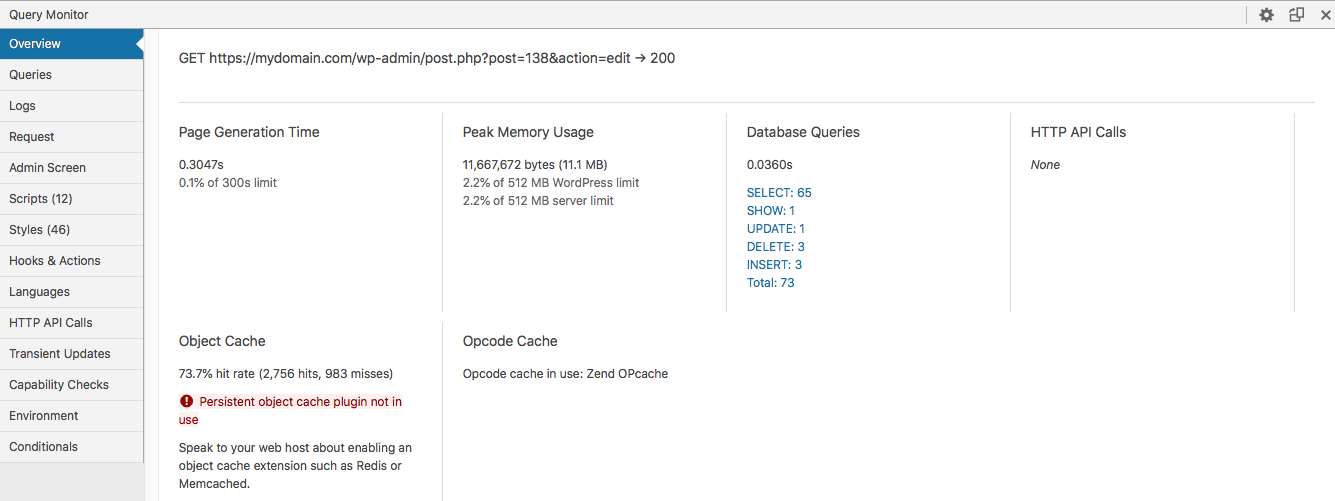
These metrics are an important starting point to determine where slowness in your page loads may be coming from, and together with optimizing your server environment, improving these metrics will increase performance and page loading speed. We’ll go into each metric below:
Optimize page generation time
 The the most important metric of all to judge speed and performance is the Page Generation Time. This is the total combined time it takes to perform every action that is needed to generate the page, including DNS requests, database queries, API calls, running all PHP functions from your theme and all active plugins, loading all assets like CSS and JavaScript files, fonts, icons and images, running all JavaScript functions and AJAX requests, etc.
The speed at which each of these actions can take place depends on many things, each of which can be optimized for performance. Your server environment plays a large part in this. Another important factor that Query Monitor can help improve is the amount of database queries, and time they take to run, which we’ll discuss below.
Besides the obvious choice for faster server hardware your site is running on, optimizing your database and MySQL, and your queries, the amount of other things you can do to improve your page load time is near endless. Some things can be very simple to check and implement, others can take a lot of time and determination. We wrote a separate tuturial on how to improve you page load speed to give an overview and get you started.
In the Overview panel you can see how close the Page Generation Time is to the server limit, determined by the max_execution_time server setting. If your site has very heavy pages, you may want to look into increasing this setting in php.ini to avoid time-outs and pages not loading properly. The Environment panel also shows a selection of other server settings that can be set in php.ini.
Improve facet filtering speed
If you are seeing slowness on your listing pages when filtering, keep in mind that FacetWP can be only as fast as your uncached site. This is because FacetWP uses AJAX requests to refresh the facets and results listing. WordPress AJAX requests aren’t cached by default and require all of WordPress to load. FacetWP uses WP’s init hook to ensure that WP (and all other plugins) are loaded. Otherwise, no integrations would work, post types wouldn’t be registered, etc. This means that if it takes three seconds for the initial unfiltered (uncached) page to load, then it will also take three seconds for a filtered AJAX request.
The effect of this is that if you have any type of page caching (like WP Rocket) enabled, the initial (unfiltered) cached page load may be faster than the AJAX filtering after interacting with facets, sorting, or pagination. Page caching works by serving pages directly from the cache, as pure HTML, CSS, and Javascript. The database is never queried in this process (except the first time to generate the cached page itself), so serving these cached pages is very fast. But caching plugins like WP Rocket (intentionally) do not cache AJAX requests. So FacetWP’s subsequent AJAX requests (for filtering, pagination, sorting and loading the updated results) have to query the database on each page load, and will show all inefficiencies that may be present in that process.
If you see filtering being slower than the initial (or other) cached page loads, it’s tempting to come to the conclusion that slow filtering or pagination is caused by FacetWP. Although possible, this is very unlikely. Most often it is due to (a combination of) server performance, inefficient listing templates or loop code with large amounts of queries to render each post, the amount of content, or other plugins slowing the AJAX request. Even on a fast server, FacetWP can only be as fast as the slowest plugin on your site.
Certain types of caching can help to speed things up, but if you don’t resolve the underlying issues, you are just sweeping all inefficiencies “under the rug” and they will keep slowing down each AJAX request.
If you want to test the above and see the true speed of your uncached pages, you can try the following:
- With page caching (like WP Rocket) enabled, go to a non-facet page and append
/?123to the URL to bypass caching (use a different number each time). You can compare this speed with FacetWP page loads (after filtering, paging or sorting) which are also uncached. - With caching disabled, click on a filter so the URL contains the filter options, then refresh that pre-filtered page URL. This will show you the true actual total page load time of a facet page.
That all said, there are things you can do to improve facet filtering itself, like reducing your total number of posts and posts per page, reducing the number of facets, using our Listing Builder to create your template, and caching FacetWP’s AJAX requests.
But realize that improving your uncached page loading speed and your database query time are the most important (and often only) ways to improve the speed of FacetWP’s filtering. See below for how you can decrease the total query time by reducing the total number of queries and optimizing slow queries. As for other things you can do to improve your total page load time, check out our tuturial to get you started.
Cache FacetWP AJAX requests
For extra filtering speed you can enable FacetWP’s Caching add-on, which caches FacetWP’s own AJAX requests in the database. The Caching add-on can help speed up high-traffic pages by preventing FacetWP from having to calculate the choices for each facet on each page load.
Each unique facet filter combination that is used will be cached and retrieved from the cache the next time someone chooses that combination. If you have many users selecting a lot of different unique combinations (e.g. entering their own location or making random assortments of facet selections), then caching the AJAX requests isn’t going to help much because those combinations will not have been cached yet. So the Caching add-on will only be effective on frequently visited pages (like landing pages) with only a few facets and facet options/combinations that are used often.
The FacetWP Caching add-on doesn’t cache anything else than its own AJAX requests, so it will not negatively affect other caching systems you are using. It can be used side-by-side with other caching plugins, like WP Rocket, because most of them intentionally ignore AJAX requests.
Depending on how often your content changes, you may want to experiment with the cache expiration time. By default, the cache expires after 1 hour (3600 seconds). If your content only changes weekly or monthly, it would make sense to increase the cache lifetime as well. If your content rarely changes you could set the cache to a really long expiration time, then manually clear it when necessary. That’s actually what we do on facetwp.com because our demo content almost never changes.
Optimize memory usage and availability
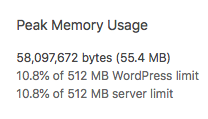 The second metric in the Overview panel is the Peak Memory Usage for the current page. It is compared with the amount of memory available on the server and for WordPress, both of which can be optimized to improve your site’s performance.
Optimize database queries
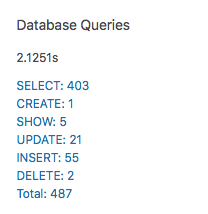 The third metric in the Overview panel are the Database Queries. It shows the combined time of all database requests, the total number of queries and the number of queries of each MySQL command.
If you want to optimize the performance of your site’s uncached pages, reducing the total database query time is one of the most important things you can do.
The total query time of a page will be determined by the number of queries and the time each of them needs to run. So logically the goal of optimizing your queries is to reduce both. You can do this by eliminating queries and removing duplicate queries. Whether you do this by making code optimizations in your theme, and/or by deciding to remove certain components or even plugins does not matter: as long as the total query time goes down, your total page loading speed will increase.
When you are using FacetWP, reducing the total query time is even more important. This is because FacetWP uses AJAX calls for filtering results, and AJAX requests are uncached, as explained above.
Queries panel overview
The Queries tab gives an overview of all queries running on the page. You can filter by SQL command, Caller (function), and Component (plugins, theme, WordPress Core). You can sort by the number of database rows affected and the query time. If you click on the blue “+” icon next to the caller function, you can see the whole call stack, including the file names and line numbers:
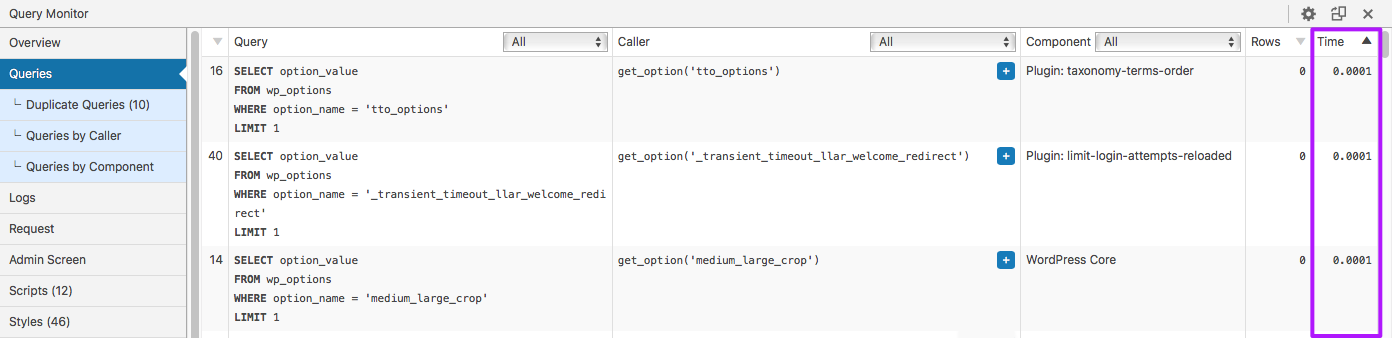
Filtering by query time will give a first idea of which queries are taking the most time and what their origin is.
You can dive deeper by selecting “Queries by Caller” and “Queries by Component” in the left-hand navigation. The latter one you can use to profile your plugins.
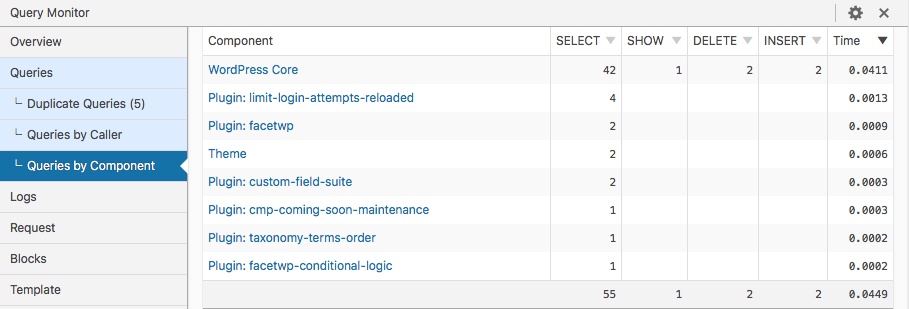
Plugin profiling with Queries by Component
The Queries by Component tab shows aggregate information about the database queries that were executed by each plugin, the theme, and WordPress Core during the current page load. This is a good way to identify poorly performing themes or plugins.
The components are sorted by the total time taken for all queries executed by each. A plugin that performs a high number of queries, or performs queries that are slow, will contribute more to the time that your page takes to load.
To be sure of the impact on the total query time and total page load time, you can temporarily deactivate a troublesome plugin and see how much the total query time improves.
If the situation is more complex, for example with plugins interacting, try to deactivate them one by one and analyze your metrics after each change. Or de-activate them all together and activate them one by one until you see which one, or which combination is the main culprit.
A lot of performance can be gained by (re)considering the plugins you are using, de-activating unnecessary or heavy plugins, and making sure the remaining ones work well together. Also make sure to de-activate any plugins you are not continuously using, like WP All Import, database optimization plugins, and Query Monitor itself.
In our tutorial about how to improve page loading speed, you can read more about other ways to profile your plugins.
Analyzing Slow Queries
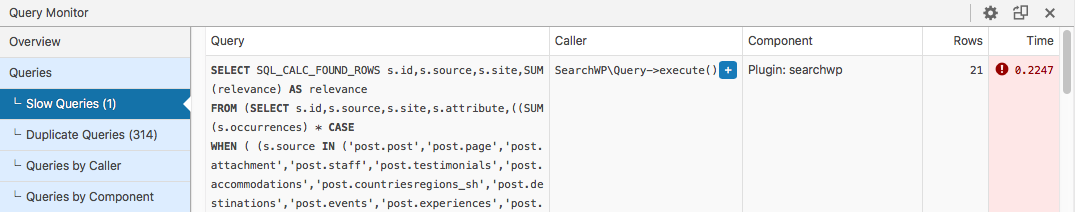
 If your page has slow queries, the navigation bar will warn you with an orange-brown color. The Slow Queries tab shows them in a red color with a warning icon.
Slow queries are queries that take above the threshold of 0.05 seconds to run. Slow queries that happen on each page load will hurt performance, so it’s worth analyzing them to see where they come from and how they are constructed.
If the origin of a slow query is in your theme files, you can sometimes easily fix them by constructing them differently. Or it can lead to a decision to eliminate them entirely by deleting certain code sections, widgets, or components. If their origin is a plugin and the problem is unfixable (check with their support or look for similar issues in their GitHub Issues section), you could decide to de-activating the plugin and look for an alternative solution.
Note that not all slow queries are necessarily problematic. For example, a query that takes 20 seconds but runs only once a month (for example triggered by WP-Cron) is probably not a source of concern. But a query that takes 1 second to run on each page load is a concern.
Analyzing Duplicate Queries
The Duplicate Queries tab gives you an overview of queries that have run multiple times. You can see the Callers (the function calling the query), Components (plugins, theme WordPress Core), and the “Potential Troublemakers” (the ultimately responsible function).
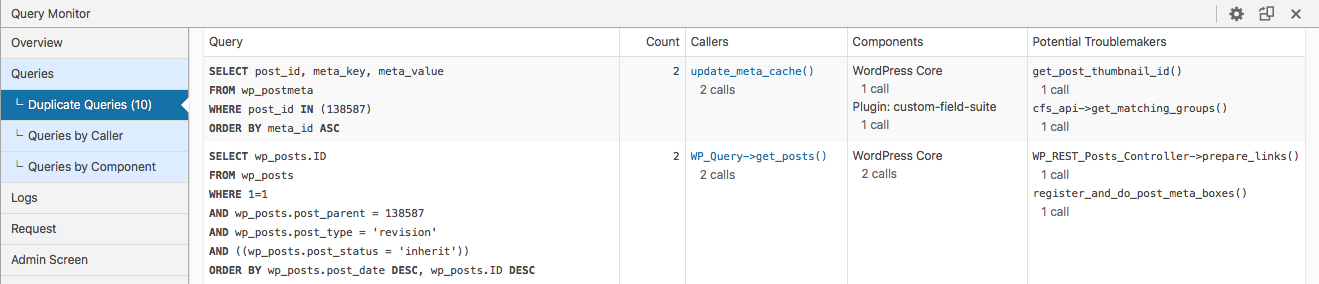
To a certain extent, duplicate queries are to be expected and normal. But analyzing them can give you clues to determine which ones may cause slow page loads, and ideas for how to prevent them. Pay specific attention to queries that run more than a few times. These may be caused by inefficiently constructed theme, template, or loop code.
Reducing the number of queries
A well-constructed page will generally only have a few dozen to a maximum of 100 or so queries on a page. For context, our cars demo runs 23 queries, and FacetWP itself only runs a handful of queries.
We’ve seen pages (mostly built using page builders) that sometimes run thousands of queries. Even if each query takes only milliseconds to run, and there aren’t any slow queries, the sheer number of queries can negatively impact your page loading speed.
Optimize your post loops
On your quest to reduce the number of queries, pay special attention to queries running in loops, like in your results listing template. Unnecessary or duplicate queries within loops can have an exponentially negative effect because they will run as many times as the loop runs, sometimes even calling other querying functions.
For example, if your template has 40 posts per page, and each post item needs 5 queries to show all information, the total number of queries needed to build the listing part of the page is 200. Even if you have only one unnecessary query, taking only milliseconds, because of the number of times it runs it can have a – sometimes huge – negative impact on the resulting total query time.
The best approach to reduce the total number of queries in your results listing loop is to:
- Reduce the total number of posts
- Reduce the number of posts per page
- Reduce the number of queries per post
- Avoid slow meta queries
Reduce the total number of posts
To get accurate facet counts, FacetWP needs to use the unpaginated query. So it helps to reduce the total number of results in your listing query, especially if you are not using pagination. Split up content in different listings/archives, or offer content in separate category/term archive pages.
Reduce the number of posts per page
In the above example of 40 posts per page and 5 queries per post, if you limit the number of posts per page from 40 to a more reasonable 16, you have reduced the total number of queries from 200 to 80. If you can also eliminate 1 query per post, you have reduced the total number to 64, which is only 32% of the initial 200, possibly shaving tens of seconds or more of your page loading time.
Reduce the number of queries per post
As seen in the example above, every eliminated query adds up real quick. First of all, make sure each query is really needed for the post item showing in the results listing. Does each post really need all that info? Can you simply leave some things out, or maybe move that info to the post’s single page?
Or see if you maybe have used a function that uses a query for something not post-specific. If so, you can prevent it from running each time in the loop by placing it outside the loop. If you store its output in a variable that you call each time from within the loop, that query will run only once and you have reduced your number of total queries by the number of times your loop runs.
Eliminate or optimize HTTP API calls
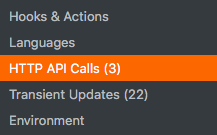
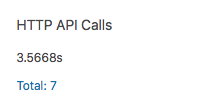
The HTTP API Calls panel shows information about the server-side HTTP requests that were triggered during the current page load. These are usually “invisible” causes of slow loading pages.
Plugins, your theme and WordPress Core continually make external HTTP requests to API’s or their home base, for example to check for updates, licensing information, or other data. These request can happen at scheduled intervals (triggered by WP Cron) and can coincide with (or are triggered by) visitors’ page requests.
Some of these API calls can happen simultaneously or take a very long time to run. Sometimes they time out if the server they are calling is temporarily busy or unavailable. If the request’s timeout setting is long (e.g. 10 seconds), the server is unresponsive and the request tries to contact the server multiple times, you’ll be waiting 20-30 seconds or even longer. All that time these requests are blocking the normal page load. This is also the reason that logging into WordPress Admin or opening the Plugins page can sometimes take a very long time.
The HTTP API Calls panel will only show requests that are made during the current page load, so the requests you see will change each time you reload the page. The overview shows the URL requested, the header Status, the Caller (triggering function), the Component (plugin, theme, or WordPress Core), the Timeout set for that request, and the Time the request took. Query Monitor will show you exactly what happened if something went wrong, or a request timed out:
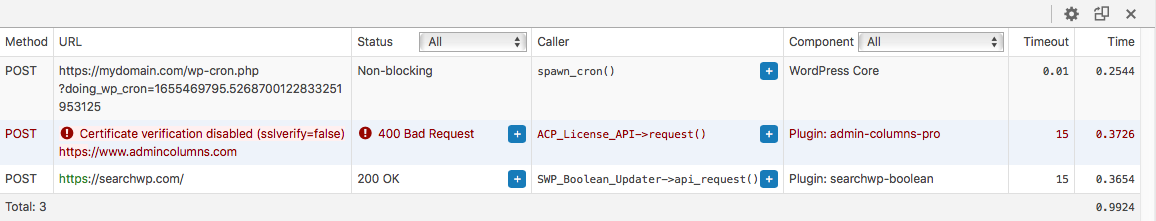
Be aware that Query Monitor will show these HTTP requests only as they happen. But because these requests happen infrequently or on a cron schedule, you don’t always see them. A solution for this problem is the Log HTTP Requests plugin. It logs all WP Core, plugin, theme and AJAX-based WP_HTTP requests and stores their run time, so you can later diagnose potentially blocking requests.
If you find any blocking requests that are running on a cron schedule, you could look into replacing WP’s built-in cron with server (“real”) cron.
Enable object caching
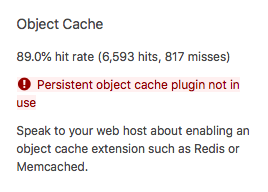 The Overview panel shows you information about the object cache in use and its “hit-rate”.
By default, WordPress uses a non-persistent object cache, which means repeated operations within the same page load get cached but repeated operations across different page loads don’t.
If you don’t have a persistent object caching plugin active, Query Monitor will show you the warning “Persistent object cache plugin not in use”. A persistent object caching plugin greatly improves performance by caching the result of database queries and HTTP API calls across different page loads, so it’s worth looking into if you want your pages to load faster.
Object caching can be enabled by installing a persistent object caching plugin for a driver such as Redis or Memcached, or by using a caching plugin that offers object caching, like W3 Total Cache.
See our tutorial section on object caching in general for more information.
Enable OPcode caching
 In the Overview panel, you can check if your server is already running OPcode cache.
When a PHP file or script is processed on the server, it first has to be compiled into machine-readable OPcode. PHP’s built-in OPcode cache (Zend OPcache) stores the converted OPcode so that PHP will be able to skip the compilation step the next time that specific file or script is needed. Using OPcache significantly improves the performance of PHP. For medium to large sites, it can speed up WordPress threefold.
See our tutorial section on OPcode caching for more information.
Optimize your server environment
If you are unsure of which software or version is running, Query Monitor’s Environment panel gives a handy (but condensed) overview of your server environment:
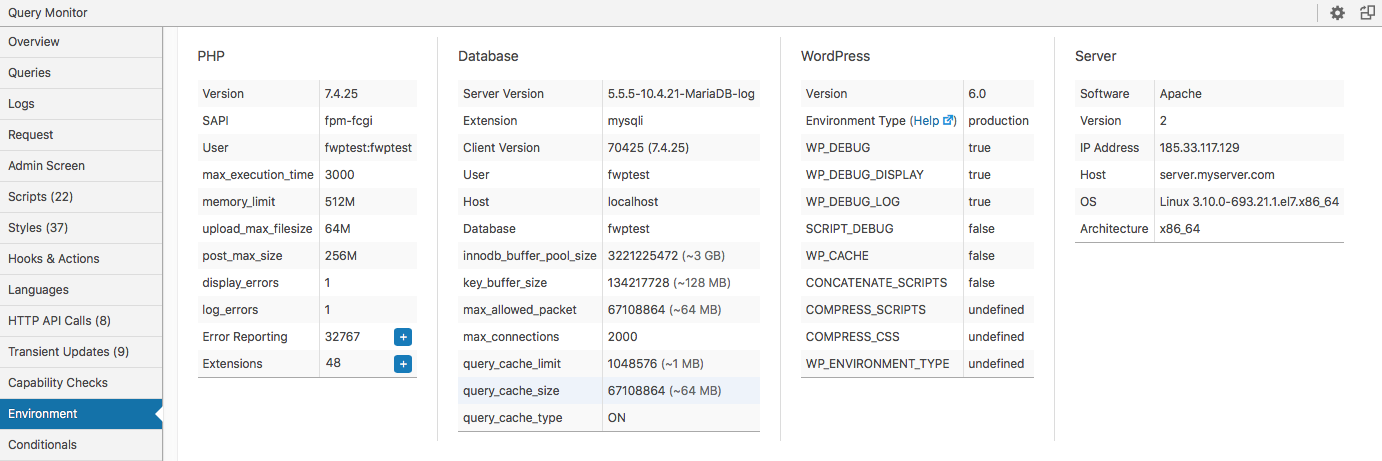
From left to right you’ll see:
PHP
- The PHP version – if possible use the latest PHP version, as this can improve performance significantly.
- The server’s
memory_limitsetting – see our tutorial section about how to change the server’s and WordPress’ memory limits. - Other useful server settings like
max_execution_time– see our tutorial section about more server settings you can change in php.ini or .htaccess.
Database
- The database software version: MySQL or MariaDB – see our tutorial about how to optimize your database.
- The most important database server variables – see our tutorial sections about database storage engines and MySQL tuning for more information.
WordPress
- The WordPress version – needless to say it’s wise to stay updated.
- The values of some WordPress constants – you can set these in wp-config.php.
Server
- The server software, being Apache or Nginx – see our tutorial section about why you may want to choose Nginx for performance reasons.
- The server OS (Operating System) and version, being Linux or Windows, and the server’s architecture.
Other optimization options
The speed with which your pages can be generated depends first of all on the available hardware resources (server type, CPU cores, memory, SSD speed, bandwidth etc.) and the server- and database software that is running on it. The Query Monitor Environment panel only gives a very condensed overview of all this.
If you are looking for other ways to improve performance, there are many things you can do: ranging from choosing a faster server with more resources to upgrading your DNS, and from making sure you are using HTTP/2 and GZIP compresssion to optimizing your theme and enabling caching solutions. The list is near endless.
Check out our tutorial on improving page load speed for an overview to get you started.
Fixing PHP Errors
Keeping your code error-free is good practice and would be the first step in debugging issues. Having Query Monitor always activated while you are working on a site is a handy way to immediately spot any PHP errors. Some errors, warnings or notices would otherwise be easy to miss and could cause problems for your users, or hurt performance.
PHP notices are the lightest type of warning. Often these are deprecation warnings: warnings about functions or features that will be removed in future PHP versions. It’s advisable that you or theme/plugin authors fix them, but mostly they will not cause issues if you leave them. PHP warnings and errors should be addressed though.
If there are PHP errors, warnings or notices, or database errors, Query Monitor will let you know by displaying a red, brown or orange color in the admin bar’s metrics. An example:

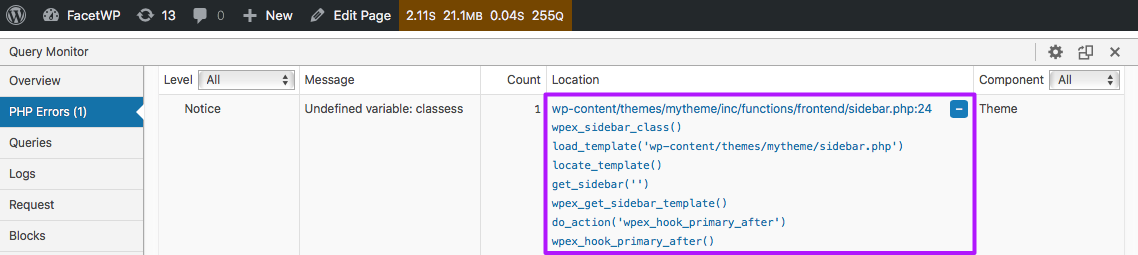
If the page can still load normally, the metrics in the admin bar will be colored, and clicking on the errors brings you to the PHP Errors panel. In this panel, you can see the PHP error level, the error message, the count, and the location of the error: which file ultimately caused the error and on which line number the problem was triggered. When you click on the blue “+” button, you can see the so-called “call stack”: the functions that have called each other leading up to the error. The last column shows the component: is it in WordPress itself, a plugin, or the theme.
Fixing PHP fatal errors
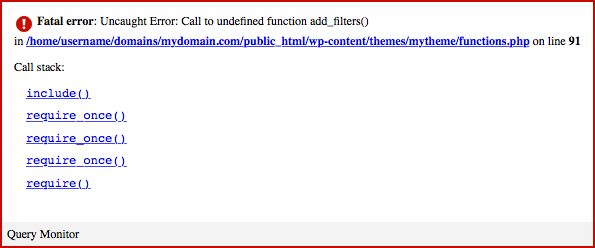
Even if the page itself cannot load because of a PHP fatal error, Query Monitor will (try to) display the error information in a red-bordered overlay showing the error and call stack:
If the information is not enough to track what caused the error, you’ll have to check the PHP error/debug log.
Sometimes even Query Monitor cannot display its error window, you’ll see the dreaded white screen, and the PHP error log will be your only way to find out how to fix it.
If it’s not a simple coding typo or a problem with a server setting (like WordPress or server memory ran out, or the server’s max_execution_time was overrun, most often the problem is caused by a plugin, and simply de-activating it by temporarily changing the plugin’s folder name (with FTP) will make your site accessible again.
Fixing the warning about db.php
In certain situations, on top of the Queries panel, the following warning is displayed:
“Extended query information such as the component and affected rows is not available. Query Monitor was unable to symlink its db.php file into place. See this wiki page for more information.”
Query Monitor will still work fine in this situation, but you won’t see extended information that makes Query Monitor much more useful, like the Queries by Component section.
This error can be caused by the wp-content directory not being writable or a range of other issues mentioned in the wiki page linked above. Most often it is caused by db.php in wp-content being in use by another plugin, usually a caching plugin. This can be W3 Total Cache (which creates db.php as a file), or the FacetWP Caching add-on (which creates db.php as a symlink to its own db.php file).
This issue is caused by WordPress’ core limitation that the drop-in plugin file must be called db.php and placed in the wp-content directory, and only one file with this name can exist there.
If you want Query Monitor to show all information it can, the only way around this is to de-activate the caching plugin that uses this file too. Then remove the db.php file/symlink manually from wp-content if it was not automatically removed. Next, de-activate Query Monitor and re-activate it again, which then recreates the db.php symlink of its own.
When you are finished, do the reverse: de-activate Query Monitor, which will automatically remove its db.php symlink. Then re-activate the caching plugin again, which will cause its db.php file/symlink to be created again.